
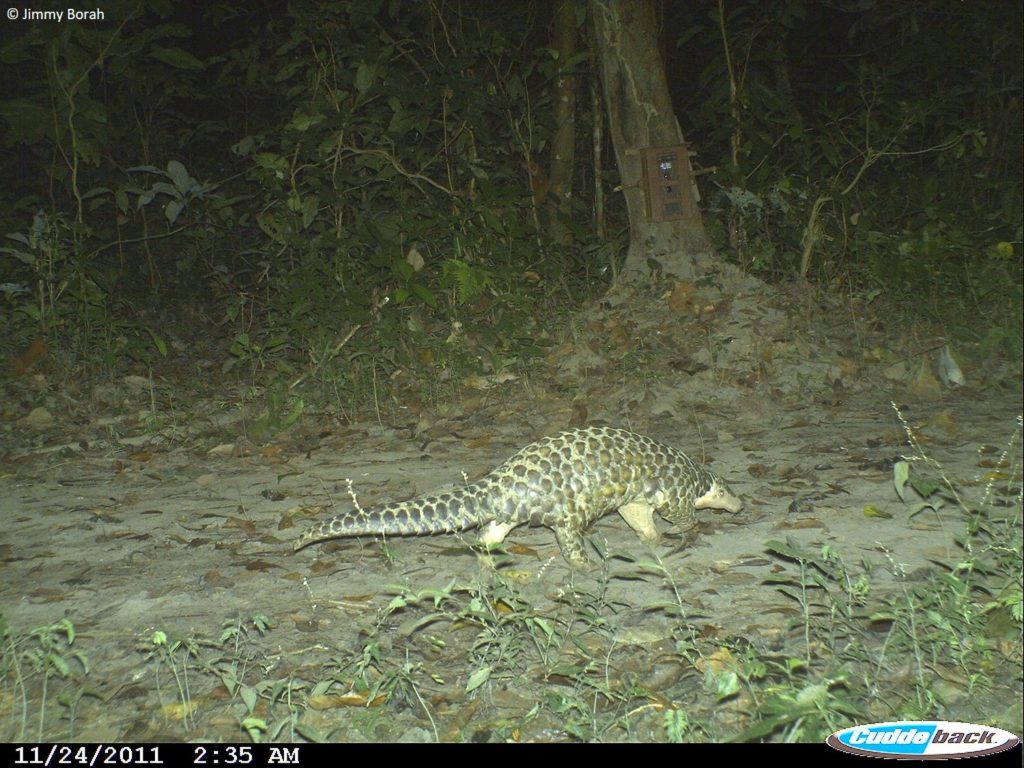
Figure 01. This Chinese pangolin caught on a camera trap is just one of the images used in the study by Khwaja, et al. (2019). Credit: Jimmy Borah
Hannah Khwaja, Field Conservation Assistant at Chester Zoo, former intern and member of the IUCN SSC Pangolin Specialist Group, tells us about her recent publication ‘Pangolins in global camera trap data: Implications for ecological monitoring’.
–
Estimates suggest that the equivalent of more than 500,000 pangolins have been poached and trafficked in the past three years. These stats are truly sobering.
However, new techniques such as genetic markers and an improved understanding of scale frequency are helping us to more accurately estimate how many individuals of each pangolin species are impacted by illegal trafficking. Yet, when it comes to pangolins in their natural habitats, we have very little idea how many there are. Pangolins are solitary, mostly nocturnal, and notoriously elusive, making them very difficult research subjects. Pangolin conservationists are faced with a serious challenge: how can we rapidly ‘scale up’ ecological monitoring to better understand where pangolins are found and how many remain? Without this information, we cannot know where best to focus our conservation efforts.
My colleague, Claire Buchan, and I set out to test one possible method during our research internships with the Pangolin Specialist Group. Remote camera traps are already a widely used method across the world for surveying terrestrial mammals and birds. Although many researchers use them to look for particular animals, the cameras are non-selective, and so collect huge volumes of data on a wide range of species. The aim of our research was to find out whether existing camera trap efforts taking place across Africa and Asia could be useful as a method of detecting and monitoring pangolin populations. As this would involve looking at lots of data from studies throughout pangolin ranges, we also wanted to use any existing pangolin records to learn about the factors affecting their distribution.
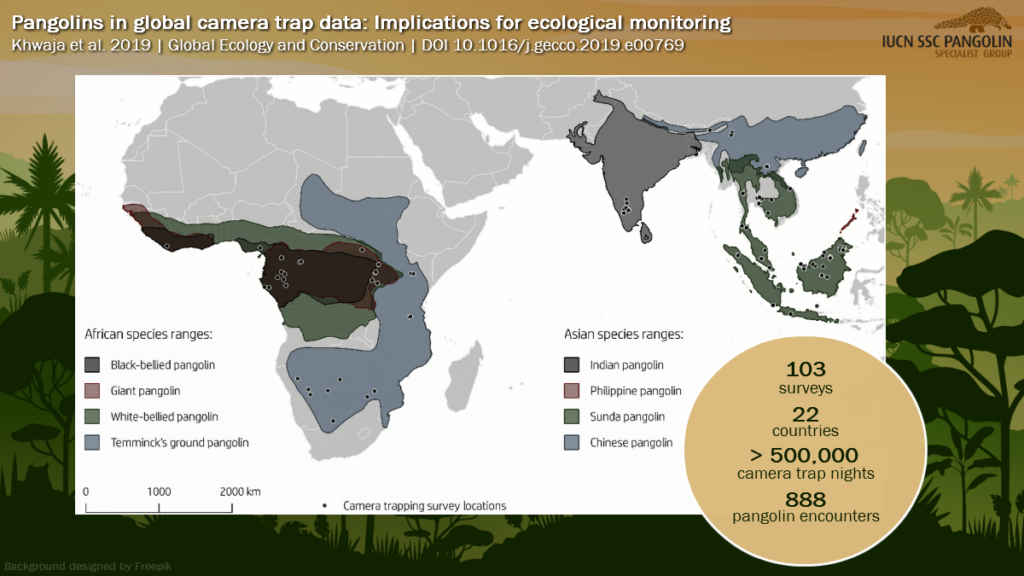
Figure 02. Map of camera trap survey locations across the range of African and Asian pangolin species. Points represent the mean camera trap location for each survey
After contacting a wide variety of researchers involved in camera trap surveys in Africa and Asia, we obtained data from more than 100 studies distributed across 22 countries. In total, these studies represented over 500,000 ‘trap nights’ (where one camera out for one day equals one trap night, and 10 cameras out for one day equals 10 trap nights). This vast array of cameras captured just 888 pangolin records. Overall, that means that the detection rate across all pangolin species was equivalent to one pangolin for approximately every 572 trap nights – that means that if you were carrying out a survey using 20 cameras, you would be likely to record only one pangolin per month! To effectively monitor the population of a study area, we calculated that you would need to place cameras at a minimum of 100 locations for at least six months for giant pangolins, and ten months for white-bellied or Sunda pangolins. With professional camera traps generally carrying a price tag of £200-£500 each, this would be extremely expensive, as well as logistically difficult.
Our results show that current camera trapping methods used for generic biodiversity surveys or targeting other mammals of similar size are not adequate for monitoring pangolin populations. However, by bringing small amounts of data from lots of different studies together, we were able to learn about some broad-scale factors affecting pangolin distribution. For example, we found evidence that both Sunda and white-bellied pangolins were more likely to occupy land outside of protected areas than within them. This could be related to prey availability in disturbed sites, and/or lower natural predation pressure outside of protected areas. More research is needed to better understand these factors.
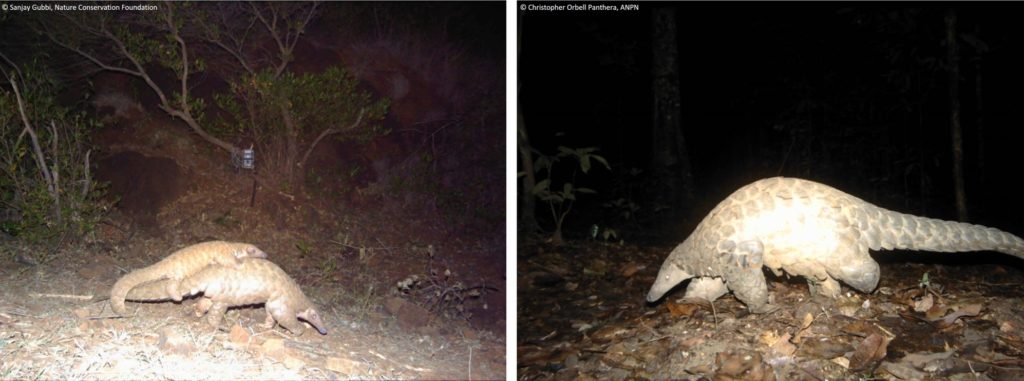
Figure 03. Further examples of camera trap images analysed in the study by Khwaja, et al. (2019). Left: Indian pangolin (Credit: Sanjay Gubbi, Nature Conservation Foundation). Right: Giant pangolin (Credit: Christopher Orbell, Panthera)
Although existing methods may not be well suited to pangolin monitoring, there is growing evidence that cameras that specifically target pangolin field signs (such as, tracks, feeding signs, or burrows) have much higher detection rates. Targeted methods informed by our ever-increasing understanding of pangolin ecology, as well as ongoing improvements in camera trap and image-processing technology, could significantly improve the applicability of camera trapping for monitoring pangolin populations as we continue on our mission to scale up pangolin conservation.
–
This study was featured in October’s special edition of Global Ecology and Conservation, titled ‘Pangolins: trade, ecology, and conservation’. You can read the full open-access paper here.